Components are built using the React Mantine library for a responsive design and are located in the @gff/portal-proto package. Components like buttons and modals, vertical tables, facets, and charts are used throughout the GDC Data Portal and are designed for re-use in applications.
Buttons & Modals
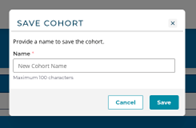
| The GDC Data Portal provides a number of buttons that can be used for various purposes. Modals are used to show transitory information or obtain information from the user. The GDC Data Portal provides many modals, such as the SaveCohortModal, that can be used for various purposes. |
Vertical Tables
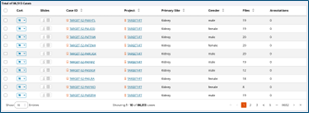
| The VerticalTable component is used to display data in a table format. The VerticalTable component is a Mantine component implementing React Table Version 8. The VerticalTable component has a number of parameters, the most important being data, columns, and filters. |
Facets
|
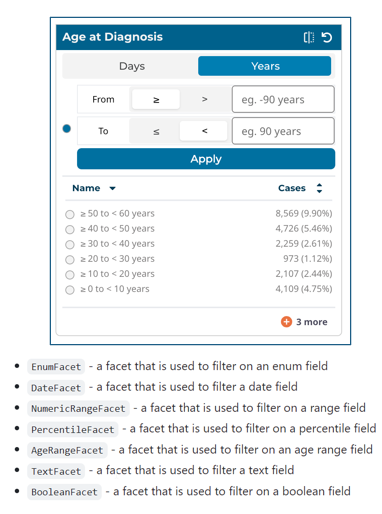
Facet components are provided for use in building local filters for an application. There are several types of facet components:
|
Charts
| Basic charts are provided for use in an application, although applications are free to use other charting libraries. Customizable bar charts, cancer distribution charts, and other charts are available in the GDC Components Library. |
For additional details, please see the GDC Application Developer Guide.


