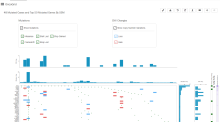
The GDC released a new version of the GDC Data Portal with new visualization tools for copy number variations (CNVs). CNVs, categorized as gains and losses, can now be visualized in conjunction with small-scale mutations (substitutions and short indels). In the Oncogrid, the colored grid is overlaid with symbols, allowing an integrated view of mutations and CNVs. Users can choose colors and which alteration types to view.
Additional information is available in the GDC Data Portal User's Guide.

